
Data sampling is a well-known statistical method to drive insights out of a big population (big data). Most of the classification, data modeling methods and machine learning algorithms performs better with an ideal data sample rather than using the entire dataset. Sampling is also important to save costs for the organizations. Instead of implementing any method, project or any external tools, third-party solutions directly, it’s more effective to test them on a sample before making the decision. Data samples are basically subsets of datasets. In this my very first post, I will explain how to do proper data sampling using R Studio.
Before I get into coding, I would like to explain the concept of “training” and “testing”:
Training Dataset: This is the main sample that you subset out of your original. You will mostly work with this dataset to build your model or algorithm.
Testing Dataset: This is the smaller sample out of your original, and it’s mainly used to test how your model or algorithm performs. It helps to compare models and pick the best one for your projects.
Important reminder: the more training data you have, the better your model will be. The more testing data you have, the less variance you can expect in your results (ie. accuracy, false positive rate, etc.). Using 80% of the dataset as training and 20% of the dataset as testing is usually a good start. Remember though, based on the results you may want to play with the sample size a bit later.
Let’s discover the two important types of sampling methods:
Simple Random Sampling
It’s basic as its name! A simple random sample is a randomly selected subset of a population. In this sampling method, each member of the population has an exactly equal chance of being selected.
Let’s see how we can create a simple random sampling in R. I am using a public dataset called German Credit Card as my original dataset.

We use the sample() function, which is one of the built in functions in R, to randomly pick indexes. We have 1000 rows in our dataset so we will let R pick random indexes out of the range 1 to 1000. After defining the range, we need to specify the portion. For our training sample we want 80% of our original dataset so, we specify the portion as 0.8*1000. Finally, if we want the indexes selected to go back in the dataset before another selection, we can call replace = TRUE. In our case, we do not want them to be replaced back in the data set each time, so we are not going to call it because replace = FALSE by default.
Now that we defined our training indexes, it’s time to subset our original dataset based on these indexes to create our training and testing samples. It’ll require 2 steps:

First, we will subset our dataset with the training indexes, and second, we are going to exclude those indexes while subsetting for our testing sample. My original dataset in my case called “new_germ” as I defined it like that after importing. What you can do is the replace that with your dataset name. Next, I am suing curly brackets to subset my original. Remember; within the curly brackets the left side before the comma represents rows, and the right side after the comma represents the columns. As we would like to subset based on the row indexes, we will use the left side. For the training data, I am including “training_indexes” for my rows. For the testing data, I am using “- training_indexes” because I want the indexes that is not picked within my sample function. At the end, I have created two different datasets, one includes 80% of my dataset called training_data and other one includes 20% of my dataset called testing_data. Now they are ready to be used for any data modeling or machine learning algorithm.
Stratified Sampling
With the stratified sampling, we have more control. In statistics, stratified sampling is a method of sampling from a population which can be partitioned into subpopulations. So, in our case, what stratified sampling does is, it keeps the portions as same as the original dataset. For example, in my German Credit Card dataset, I have a categorical variable with “good” and “bad”. When I do random sampling, I got indexes randomly, with the stratified sampling I will have exact same portion for my “good” and “bad”. If 30% of that variable is “good” in my original dataset, it’ll be the same in my training and testing datasets. This gives us more control over creating our samples and more accuracy regarding our results.
Now let’s see how we can implement this method in R Studio. We will need to install additional package called “splitstackshape” as stratified function is not a base R function.

So, we installed the package and called the library, so we are able to use it. Next, we will see how to use the stratified function.

Within the stratified function, first we specify our dataset. Here make sure that your data is set as a data frame. I used as.data.frame function to remind R that my dataset is in a data frame format as the stratified function requires. We have also other objects to specify which variable we are basing our sampling. In my case it’s my “good-bad” variable which it the 21st variable. So for group object I used 21. With the size object you can specify the portion of your sampling. As we would like 80% for our training it will be 0.8. Lastly, we have a boolean object called bothSets which we will set TRUE because we want both training and testing datasets to display.
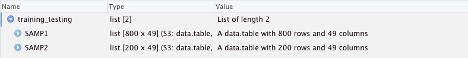
As you can see above, stratified function creating a list of two datasets. One has 800 rows which is training dataset called SAMP1, other one has 200 rows which is testing dataset called SAMP2. Now I would like to subset my datasets out of this list so I can use them separately.

Finally, I have two variable represents to different datasets for training and testing as I have it in random sampling. However, this time I can make sure that the both sample set carries the same characteristics as my original dataset.
Conclusions
- Data sampling is crucial in terms of cost saving for the companies.
- It’s easier for analysts to deal with the data, more effective, less time consuming.
- Creating two samples as training and testing gives us a lot of room for improving our models by testing.
- More training data means better your model is, more testing data means less variance you expect.
- Random Sampling and Stratified Sampling are the two popular methods.
- You can use R studio to implement the both methods.
- Stratified Sampling gives us more control as it allows us to keep the same characteristics as our original dataset hence more accurate results.
Resources
