
Bang Bang!! In my very last post of 2020, I would like to introduce you a very useful package in R called “dplyr”. If you haven’t yet, install “tidyverse” to your R studio. You can write install.packages(“tidyverse”) to your console and it’ll install the package. Tidyverse contains multiple packages created by Hadley Wickham and one of them is the dplyr package that you will learn reading this post. The dplyr is a useful package in manipulating data. Looking at the name of the package, you can think that d represents data and plyr is sort of an abbreviation for player. So, using this package you can play with your data to reshape it for your convenience. We will deep dive now to learn the five core elements of dplyr which are: select, filter, arrange, mutate, and summarize.
Also, I am creating this post in R Studio using markdown which is a very useful document for your portfolios. I will create an another post later to show you how you can create your projects as a markdown in R studio.
Alright let’s get into dplyr and discover this magical package!
Calling the library
I will start calling the library so that my script knows I will be using dplyr package.You can also call tidyverse as it contains dplyr. It’s up to you.

Getting a dataset
Here I am creating a small dataset to use moving forward. Creating vectors to use as my columns and then use cbind function to put the columns together to create a data frame.

Let’s check the dataframe I just created above.

I will use as.data.frame function to make sure what I created is in a data frame format and call it again to see the difference. R now knows that what I created is a dataset. This is important for the sake of your analysis moving forward because the dplyr package only deals with data frame formats.

Here I just realized that the data frame took the numerical values as characters and I would like them to be numerical. So I will add additional step here to convert them to numerical values.

Now we are ready to go and discover the beauty of dplyr. One thing to now before we start: While coding with dplyr, we add pipe operator (%>%) at the end of each line. This operator kind of tells R that we are not done with coding and we will be adding another line.
Arrange
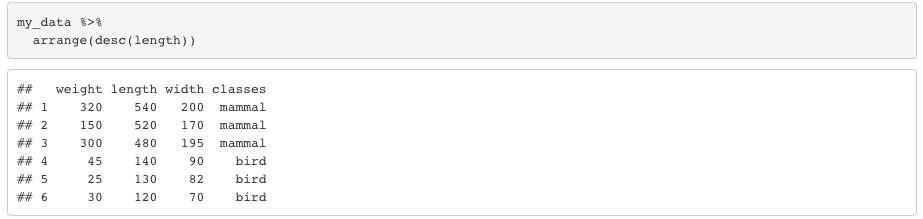
Arrange function keeps the entire data frame but it’s helpful to change the order of the rows. The function use ascending order by default but you can also set it as descending.

Let’s set the order as descending. You will that this time R arranges the rows in the length column in descending order. If you apply the same function for the character columns, it’ll order the rows alphabetically by default.
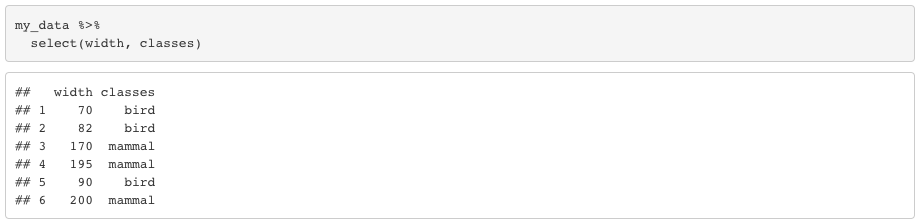
Select
Select is pretty basic, it just displays the columns you would like to select. Let’s say you only want to see width and classes columns.
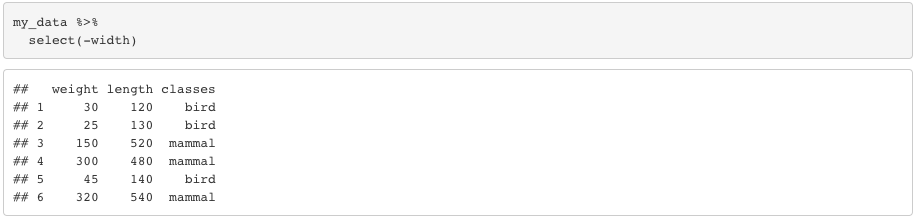
You can also use a “-” sign to get ris of a column.
Filter
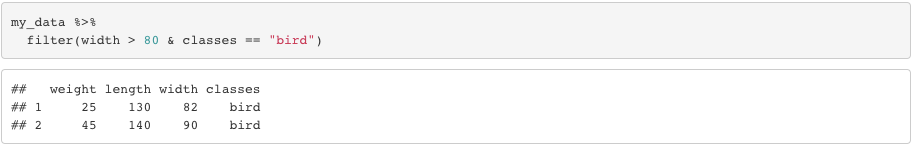
Filter function does what the name says. Filter the rows you need.

You can also filter using multiple conditions. Realize that I used “&” operator to combine both conditions.
Before filtering, you can also add group_by function to filter based on groups instead of each row. Like if we group by classes and then filter, R will do the filtering based on classes.

Realize that R checked “bird” and “mammal” to check max values instead of each row separately.
There is also n() function to count the elements in each group while filtering.
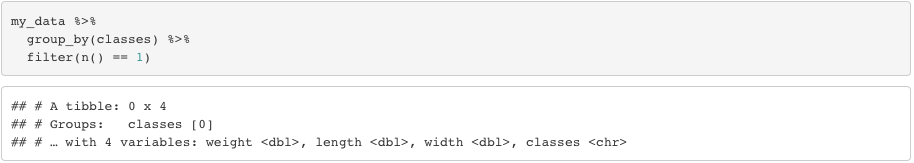
Realize that this piece of coding didn’t display any rows because, neither “bird” or “mammal” has only one elemnt. They both have 3 elements. If our data frame has only two rows with “bird” and we code filter(n() == 2), we would see the outcome displaying the rows with the class “bird”.
Mutate
Mutate function helps adding new columns to your dataset.
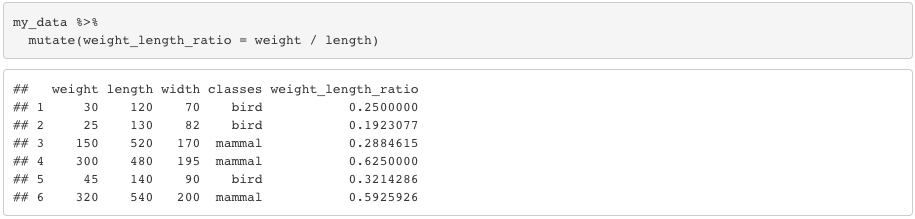
Now that we learned most of the verbs, we can start combining them. Lets arrange the ratio in descending order. I will also add a round function to round the decimals.

Note that, if you use transmutate instead of mutate, it’ll give only the variable(s) you just created as the outcome. You can also use group_by to mutate based on group level instead of rows.
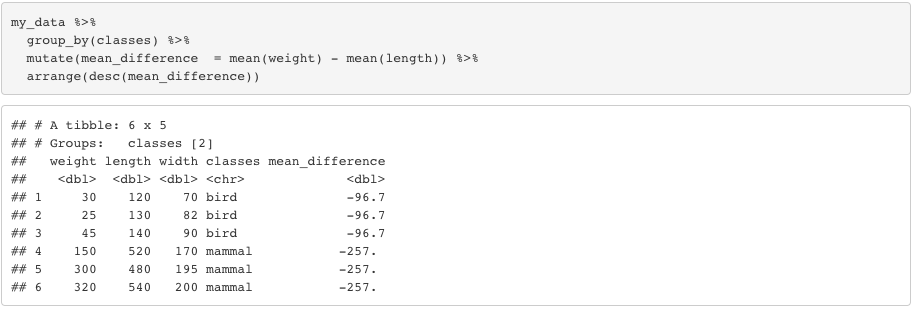
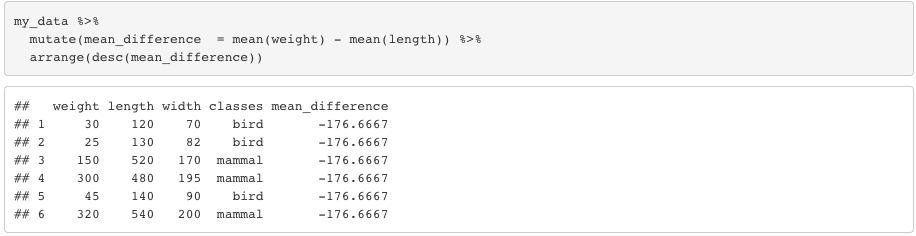
See what would I get if I didn’t use group_by. Realize that group by tells R to take the mean based on classes.
Summarize
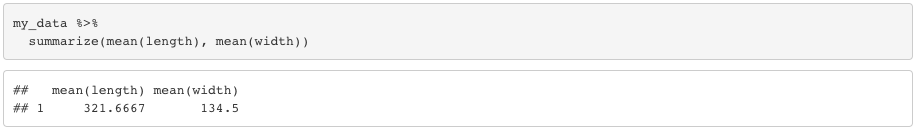
Summarize function basically returns whatever you would like to see as an outcome. Like if you would like to see the mean of a column or multiple columns you use the summarize function.
You can also summarize with group_by function.

That’s it!!! Now you learned all the verbs in dplyr package. You should realize that all the verbs you just learned can be combined. I used a small dataset to make it simple but when you use much bigger datasets, you will see the beauty of dplyr more.
Another great thing is; you can take your outcomes you created with dplyr package and put them into ggplot2 to visualize it. I will get into ggplot2 and plotly (the packages to create beautiful visuals in R Studio) in more details with another post but i would like to show a small example hpw you can put the tables you created into a plot.
So what you can do is, you can define the entire lines of code into a variable. The next thing you do is to use that variable in ggplot2. Let’s take our last example about summarize function.

Let’s put my_plot in ggplot2.


As I said, don’t worry about the coding for the plot if you are not familiar with ggplot2. Wait for an upcoming post next month! Hope this was helpful for you to understand the concept of dplyr. It is a very straight forward and helpful package.
I also hope next year will give me more inspiration and time to keep writing and sharing my knowledge. Keep coding and see you next year! 🙂
