
Hello pirates! I had to skip January because of my tight schedule but I am back with my first post in 2021. I have been dealing with machine learning projects the last couple of months, so I wanted to write this post to share my learnings.
What is “Feature Engineering”? Well in a nutshell, it is 90% of your workload while dealing with a machine learning project. When I heard this from my professor, I couldn’t believe it but it literally was. Machine learning algorithms for sure way complex, it takes time to understand each of them in theory. However, practically there are packages in Python and R that makes things smooth. Scikit-Learn (Python) is one of them that I practiced but there are other packages available as well. A few lines of code and you have your model. However, it’s very important to have your model the right features to be able to see the optimum performance which is where feature engineering kicks in.
Further in this post, I will try to break things down to give you a better understanding of feature engineering. I will start with some basics and go into specifics of how to deal with different types of variables: continuous, count/interval, categorical. Then will end the post with some extras. Keep in mind that all the coding shared throughout this post made in Python. I won’t be giving every detail of the coding such as how to import the dataset.
Let’s get started!
Missing Value Flagging
Before removing or imputing the missing values, it’s valuable to flag them in an additional feature (column). Having missing values could be insightful and might improve your model’s performance. You could start off checking the missing values in your dataset. I have the Ames Housing Dataset which examines features of houses sold in Ames during the 2006–10 timeframe.
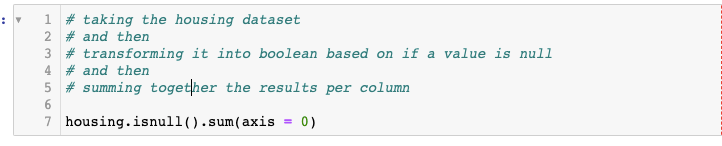
Next, we are going to code to flag the missing values we found out.

After doing this, you have new columns (in my case 4 new) in your dataset so, now you can decide what to do with your missing values. It’s totally up to your intuition to either drop them out or impute them.
Working with Continuous Data
Scatter plots are big help when dealing with continuous data while feature engineering. You can create multiple scatterplots using matplotlib package in Python. For the y-axis, use your response variable, in my case it’s the sale_price. Then for the x-axises use your continuous variables to see types of trends. With that, you could identify outliers, you could see some variables has too much “zero” values and such. Going through this process gives you an idea to engineer new features based on those trends.
In the housing dataset I found out multiple variables with high volume of zero values so I created new features based on that using the piece of code below.
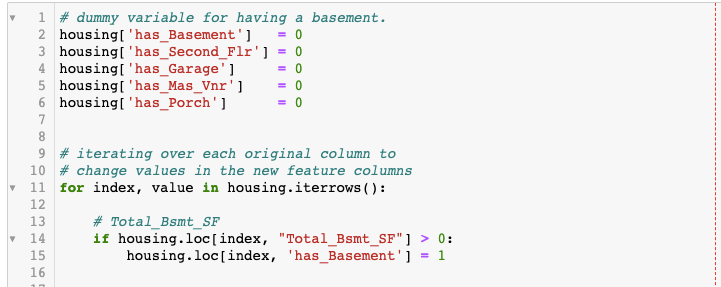
With the code (partial) above, I identified the variables greater than 0 (threshold) and flag them as dummy variables. If the “total basement” feature is greater than 0, I marked it as “1” in a new column called “has_basement”. You could use this technique in any type of purpose, it’s very useful and highly recommended to create dummy variables based on the trends in your continuous variables. Let’s take a look at what I created.

Working with Interval and Count Data
Dealing with interval/count data, scatter plots are not the best option. Therefore, it is a better practice is to use box-plots when visualizing relationships with such data.
Tips to Analyzing Relationships with Box-plots
- Start by analyzing differences in the median lines for each box-plot. Does it appear that the median lines can be connected using a straight line? If not, move to the next bullet point.
- Log transform the data as needed (make sure the data contains no zeroes or negative numbers).
- Engineer features as necessary. Make sure to check value counts to ensure you have at least 100 observations in each part of your newly-engineered features. (Hult International Business School – Prof. Chase Custerer)
Just a quick tip: If you would like to try log transformations, you can use numpy package in Python. See the code below:

After creating log transformed new features, it’s a great practice to check correlations to see if what you have done is useful. Besides that, realize how I specify the package name as “np.” before using the log function. Make sure you import the packages you would like to use before in the script (better practice to import them in the chunk of code that you import your dataset.
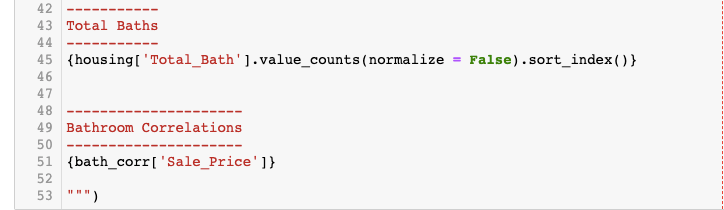
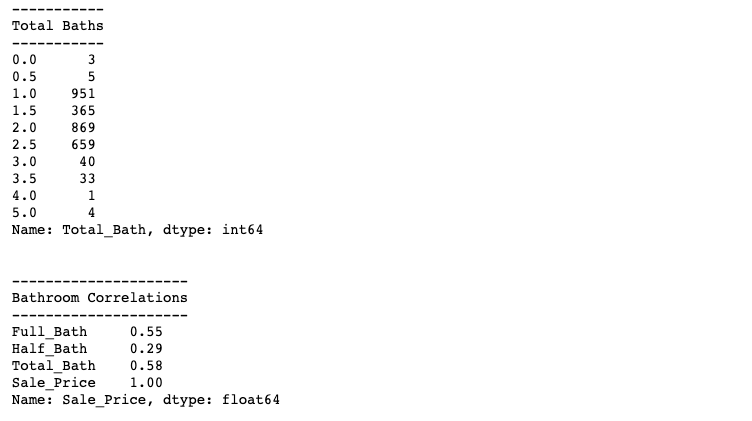
With interval/count data, instead of setting threshold values, it’s more useful to combine variables if you see a possible opportunity. For instance, with housing dataset, I realized I could combine “full bathrom” and “half bathroom” variables to create a new variable called “total bathrooms”.

Besides box-plots and combining your variables, it’s also valuable to check value counts in the recent features and new features you have created.
Encoding Categorical Data
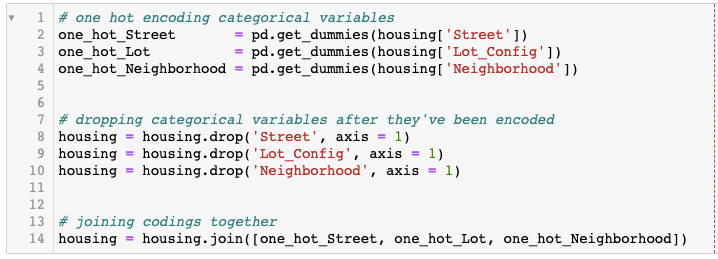
To one hot encode each categorical variable, we use get_dummies function from Pandas package. After creating dummy variables, it’s important to drop categorical variables because they will cause issues in your regression and classification model algorithms. Those algorithms only like numeric variables. See the code below I used with housing dataset:
Extra Methods for Feature Engineering
Here I will add some extra methods that you could use with your datasets.
Working with Email Addresses
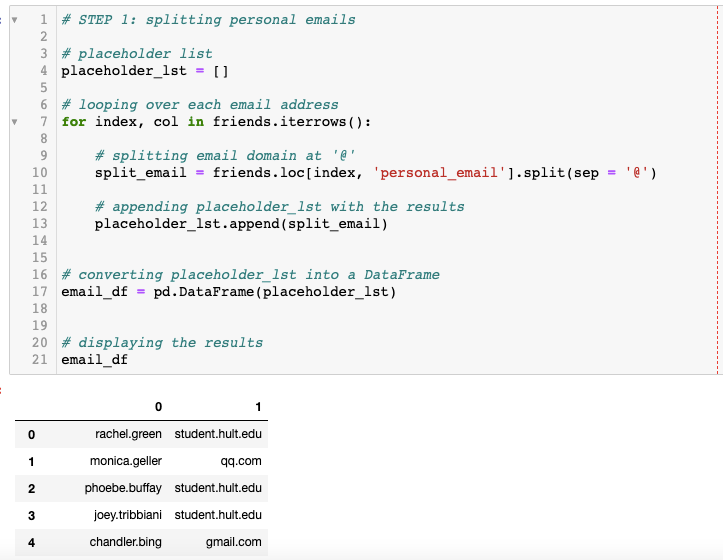
Dealing with email addresses can be tricky but insightful for your models. You can use split() function in Python to split them after the “@” sign which will give you an ability to categorize them based on the domains. For instance, you may have some emails associated with work (some company domains), or personal (such as gmail or yahoo), identifying the characteristics of email addresses could give you an ability to interpret demographics. See my code below to split the email addresses in another dataset. In this section I will use “Friends” dataset which is a dataset made based on the TV-show.
Next I will name the second column as “personal_email_domain” and print the value counts.

Lastly, I will aggregate the email domains into personal and professional groups.
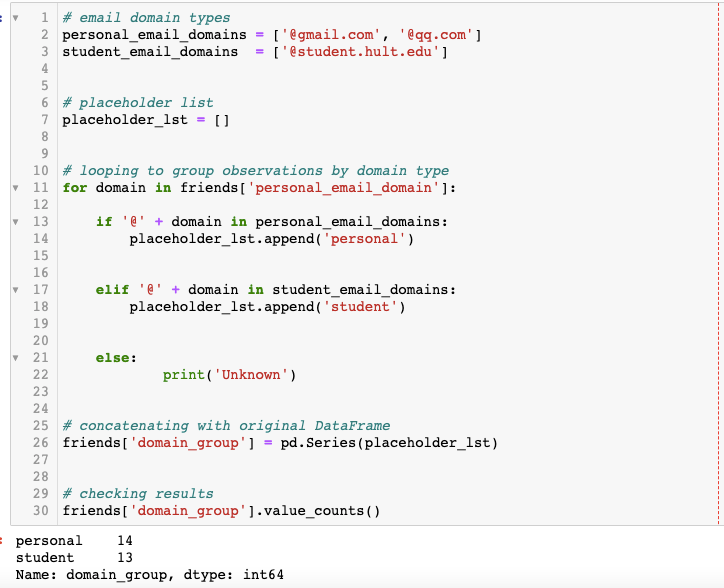
There you go! Now you are able to categorize the email addresses based on the domains.
Working with Names: Gender Guesser
This is the fun part. Python has a package called gender_guesser.detector which guesses gender based on the first names in your dataset. Gender can be a valuable demographic information for businesses, so including this in your algorithms may increase the performance of your models.
To be able to use this package first I needed to import it:

I used the same friends dataset to check how gender guesser works:
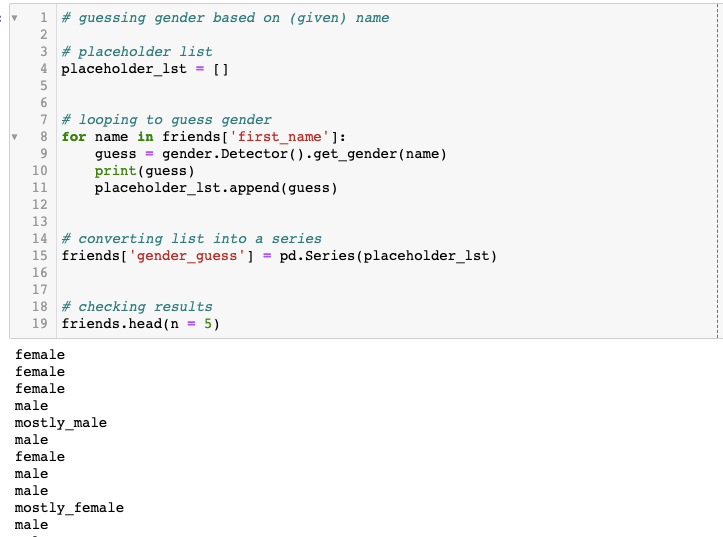
Let’s see what did we get at the end with the friends dataset.
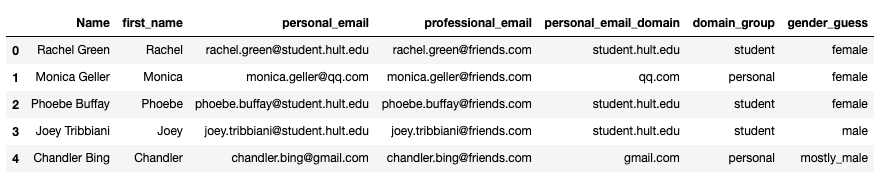
So, we had the columns Name, first_name, personal_email, professional email. We added columns personal_email_domain, domain_group and gender_guess. If we find any of these information valuable, we could use the methods I went through in the section: “Working with Categorical Variables”. These new features are categorical so, before using them in any machine learning algorithm, we need to convert them into numerical variables.
Conclusions:
- 90% of the machine learning is feature engineering.
- It’s important to use business-intuition to decide which path to follow. Knowing the computer science and statistics does not give enough perspective to handle machine learning.
- Knowing your data, knowing your case comes first.
- It’s important to identify what type of data you are dealing with (continuous, interval/count, categorical…)
- More features mean more options for you.
- Make sure to understand that it’s not to goal to dump all the features in a machine learning algorithm. More features gives you more possibilities for combinations to try out.
References:
- Hult International Business School: Machine Learning-Python | Lecture Materials – Prof. Chase Custerer: https://github.com/chase-kusterer
- https://medium.com/@hjhuney/quantitative-data-exploration-for-regression-in-python-ames-housing
- https://elitedatascience.com/feature-engineering-best-practices
- https://www.analyticsvidhya.com/blog/2020/10/7-feature-engineering-techniques-machine-learning/
